
Are You Really Sure You Have Lead Paint?
A Deep Dive on the Possibilities of Erroneous Test Data
X-ray fluorescence (XRF) is a mature technology, being used predominantly in the environmental field for the testing for lead in paint and occasionally for a soil remediation project or for other environmental screening purposes. Used in the laboratory under controlled conditions, it can provide laboratory-grade accuracy comparable to methods such as Inductively Coupled Plasma Spectroscopy. It is used in other fields such as for alloy analysis and to a lesser extent for geochemical and forensic purposes. XRF works by penetrating the sample with X-rays from an X-ray tube or a radioactive source and then measuring the energies released by the excited electrons.
Its usefulness is based on the characteristic excitation patterns that are (almost) unique to each element, allowing a single instrument to detect approximately 75 elements, including most if not all of the Priority Pollutant heavy metals. The range of detection may vary some based on the type of XRF but generally extends in the Periodic Table from chlorine (Atomic No. 17) through uranium (Atomic No. 92). There are a few exceptions. For example, the Niton XRF uses a cadmium source and therefore cannot see cadmium and elements with similar spectra. Detection of the lighter elements (magnesium, aluminum, silicon, phosphorus and sulfur) is also possible with special software packages for the higher ranges of concentrations. Reliable detection is not possible for elements lighter than magnesium.
Interested in learning more?

Its a good bet that old wood windows are Lead Paint unless they were scraped and repainted at some point (infrequently the paint will test negative because it is so heavily weathered that the lead has leached out)
I’ve Gotta Gun and I’m Not Afraid to Use It
XRF instruments are typically configured as “point and shoot,” delivering the user with a calculated concentration of the tested sample in a few seconds to perhaps a minute at most. However, less commonly known is that the XRFs also allow the user to observe the spectra of each sample, whether or not it is calibrated for that element. Therefore, commonly XRF units used for lead testing such as the Niton and Innov-X XRF guns are able to qualitatively detect other elements if the user understands some basic spectroscopy. While spectroscopy can be an extremely complicated science, there are a few simple principles that can be understood with some basic chemistry background.

Graphic credit : 911metallurgist.com
Braving the Elements
For example, starting at magnesium, the lightest element detected, the electron K-shell alpha (primary) emission line and beta (secondary) emission line are 1.25 and 1.30 KeV. As one proceeds across the periodic table for increasingly heavier elements, these distinct emission lines increase steadily in increments of roughly 0.20 to 0.30 KeV. When we pass one complete period of the Periodic Table and arrive at calcium (immediately below magnesium), L-shell energies become detectable, and increase incrementally about 0.05-0.1 KeV per element. At the same time, the K-shell peaks continue to have increasingly higher energies and therefore become less resistant to excitation and start to become less relevant, being eliminated from use at the atomic weight of barium. The middle weight elements therefore tend to give the cleanest detections with both K and L spectra lines available for use. For heavier metals, there are also gamma (tertiary lines) that are smaller and less distinct but can be useful in some circumstances (such as a “tiebreaker” if there are spectral overlaps). The figure of the light element K-shell spectra below should be helpful in understanding this sequential progression of spectral lines as shown in Figure 1 below.
The XRF software looks at the spectra and measures the intensity of each peak. Depending on the software algorithms, calculations are made, adjusted for various calibration factors and a concentration is calculated. If no calibration is made for an element, the user may be able to look at the height at the peak as a gross order of magnitude estimate of the concentration of an element compared to their experience (or as measured against standards).

Not Exactly the PCS De Résistance
XRF manufacturers have not been forthcoming with data pertaining to false positives or false negatives that their instruments are susceptible to. For lead paint testing purposes, HUD releases Performance Characteristic Sheets (PCS) that explain the methodology and basis for reliable detection of lead for each XRF model approved for such testing. For example, the PCS for Innov-X states that the unit is rated to have a 2.5% false positive rate and a 1.9% false negative rate. However, there is no description of the types of errors and their causes. The Niton XLP PCS is even worse, being completely silent on the possible errors in accuracy.
Seeing the Error of Your Rays
From experience conducting Lead Paint Inspections and other testing, I have learned the types of errors that are possible. Let’s being with the “textbook” types of errors. In basic spectroscopy, there are four types of errors attributable to the basic chemistry of an atom’s electrons, dubbed “Z+/-1”, “Z!,” “Z” (or Z-misc) and “K/L.” Z references the atomic number and K/L represents the electron shells that fluoresces:
• Z +/- 1: An interference from a bordering element on the periodic table that causes an overlap of peaks. For example, high concentrations of Fe (Z=26) may cause elevated levels of Mn or Co (Z=25 or Z=27 respectively). Similarly, bismuth (Z=83) will interfere with lead (Z=82). For example, when a bottle of colloidal bismuth (Pepto Bismol) was tested, it detected the bismuth as lead. It is also possible with large concentration differentials for some Z+2 or Z-2 interferences to occur. Z+2 for lead is Polonium and Z-2 for lead is Mercury. Polonium is too scarce to be concerned with, but mercury was once used as a fungicide in some paints until being banned in 1990.

•Z!: This error type is described based on anecdotal experiences with heterogenous substrates. For example, occasionally a test sample on cinderblock or concrete will give an anomalous and non-reproducible result for lead. It is hypothesized that a small particle of lead (e.g., from fly ash) was located at or near the surface of the substrate and just happened to be energized enough in the X-ray beam path to yield a positive detection. XRF manufacturers claim that there are algorithms that correct for matrix effects and interferences as all commonly used XRF models do not require substrate correction. However, from experience, these corrections would seem to be an inexact science that reduce but do not eliminate false positives.
Similar interferences can occur if galvanized metal or plaster mesh lath substrate contains lead contamination. I also observed on a project that lead readings with an X-ray tube XRF tended to be lower than readings on the same radiators with a higher energy Cobalt-sourced RMD LPA-1 XRF. This could suggest that the latter was detecting lead buried within the radiator metal, on the coating on the hollow inside of the radiator, or even perhaps penetrating to the opposite surface of the radiator fin.
•Z: A broad catch-all term for various interferences caused when a broad band of peaks or instrument or other matrix noise hides a smaller peak. Certain types of cellulose can cause a broad “backscattering” of energy. Artifact peaks can also occur from random circumstances when two photons arrive in the detector at the same time. Such “sum peak” occurrences may include iron (K alpha=6.4) doubling up to look like lead (6.4x2= 12.8, closely resembling one of the lead peaks at 12.61). Aluminum is one metal that can cause a broad range of interferences with other metals when present at large concentrations. A false negative or a biased result can occur when the silicon inside the detector absorbs some of the energies before counted. Fortunately, false negatives for XRF tend to be associated with the heavy and uncommon elements such as thorium and uranium. Orientation can also affect accuracy. Testing of a curved surface is less accurate than a flat one. Evaluation of these types of errors require an advanced understanding spectral physics and are not further considered here.
•K/L: This interference occurs when the L-shell line of one element overlaps with the K-shell spectral line of another element. The most common example is the lead/arsenic interference where the L-alpha line of lead is in nearly the exact same location as the K-alpha line of arsenic. The lead L-shell beta line is close to K shell beta line of selenium. Therefore, both arsenic and selenium may interfere with lead. Both arsenic and selenium could occur in certain painted metal components. In addition, arsenic could present an interference with lead for painted wood components that are treated with arsenic wood preservatives (CCA).
The K alpha of bromine also falls between the L shell alpha and beta lines of lead, so bromine can also interfere with lead. Of much less concern due to its scarcity is germanium. The L-shell beta line of lead is close to the K-shell beta line of germanium. Refer to Figure 3 showing an overlap of the spectra for mercury and arsenic.

Based on a review of these error types, it should be evident that organic substrates such as wood generally suffer less interferences than comparatively heterogenous and inorganic substrates containing a number of heavy metals. Most problematic are metal substrates due to the wide range of metal alloys and substrates containing fly ash such as cinderblock and concrete.
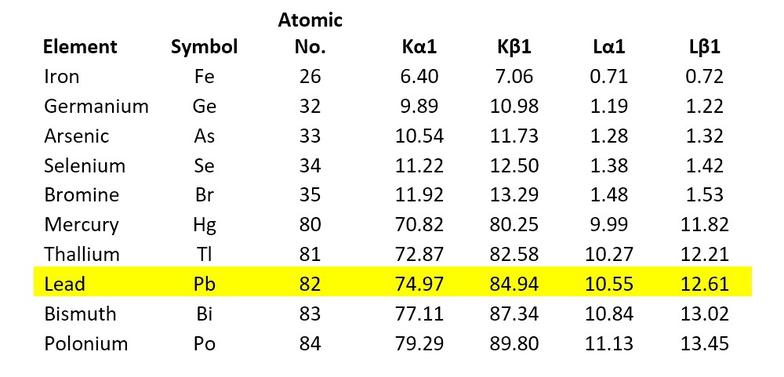
A summary of the spectra most commonly relevant to Lead Paint testing.

Mercury was sometimes added to paint as a fungicide until being banned in 1990. The most well-publicized account of child mercury poisoning happened in Michigan
User Cheat Codes
An additional source of error is the sample run-time. Some instruments allow the user to run the XRF for shorter sample periods than is specified by the PCS for lead testing. Longer testing periods allow for a better result because the signal to noise ratio is improved. The Niton XRF (among others) allows you to run the instrument in a faster mode (as brief as 3 seconds) even though the signal to noise curve only starts to flatten at about 50 seconds. The Niton PCS specifies a sample run time of 20 seconds for L-shell readings with a longer 100 second reading for the K-shell if necessary. A huge loss of productivity would be realized by collecting Niton XRF data at the fully prescribed sample length! As a minimum, a proficient Niton user should collect questionable or borderline sample results at the longer test time as specified by the PCS.
The State of Michigan has told Lead Inspectors that precision data need not be included with XRF data as it is not interpreted. The explanation was that there might be a temptation for some users to believe that the +/- precision value should be added and/or subtracted to the value to give a range, which is not a correct understanding of the term. In my opinion, it is undesirable to omit these data from data tables because it can be used as an indicator of data quality. High precision numbers are undesirable and could be used to highlight an XRF being operated too fast or other circumstances yielding sub-optimal quality data. It would be better to just properly footnote what the precision data represent.
Case Study 1- Lead-ing Me Astray
My first experience with false positives was testing a late 1960s apartment complex. There was no LBP found except for a few closet drywall ceilings, a stairwell underside, and a cinderblock wall of a stairwell. Aside from the exceptions, all the readings were very low to non-detect (0.0-0.1 mg/cm2). It didn’t make sense that only these surfaces would be painted with LBP. Confirmatory paint chips samples yielded essentially non-detectable results. I hypothesized at the time that the ceilings had electrical wire, roofing flashing debris or other leaded materials sitting on the top surface presenting an interference. The stairwell may have had fly ash contamination of the substrate from lead (a Z! error) or perhaps from mercury (Z-2) or bismuth (Z+1). Confirmatory XRF readings provided a wide range of results that wouldn’t likely be observed in a paint film. The stair underside interference was never conclusively determined but was thought possibly to be a galvanized nail head or the galvanized surface of the underside of the metal stair assembly.
At this point, I began to investigate and compare sample spectra to known standards to try to distinguish false positives.
Case Study 2- If the Walls Could Talk
A similar situation was observed another late 1960s apartment complex. The only LBP detected was a hollow wooden door and a few sporadic wall and ceiling locations. Later in the inspection, I had the fortune of testing a partially gutted apartment. This enabled me to visualize where the electrical wiring and sanitary plumbing lines (both may contain lead) were located above ceilings and inside walls. By conducting additional testing avoiding these locations, I was able to demonstrate that the lead detections were due to these electrical or plumbing interferences. The hollow door result was reported as >1.0 mg/cm2, the default reading when the analyzer is “confused” and reports a positive reading just to be safe. I have learned from experience that hollow door and drywall cavities with very thin layers of paint can result in the “Z-misc” type error.
Case Study 3- Would I Use Bad Data? Niton My Life!
I was requested by an apartment owner to perform additional lead testing of three of their apartment properties as the environmental firm that did the original testing went out of business. These mid-1960s apartment complexes, similar to the ones I had seen, had extremely low levels of lead in paint throughout the interior except for some sporadic and anomalous occurrences on a number of different components and substrates. They had utilized a Niton XLP303A. A total of 32 shots out of several thousand readings indicated interior LBP. Surprisingly (or not!), they made no attempt to interpret or question these anomalous results. Additional confirmatory testing was performed, with all non-LBP readings obtained. The false positive errors were identified as follows:
•The false positive wall reading was determined to be a small segment of wall above a closet door where wiring is typically run and would appear to be an interference from electrical wiring insulation.
•No positive lead readings were reproduced in the building interior common areas and all XRF readings were at low to intermediate levels, with a maximum detectable lead concentration of 0.4 mg/cm2, well below the LBP threshold of 1.0 mg/cm2. The stair stingers that were reported to be LBP were metal. Thus, lead impurities in the metal substrate may have been detected, as the Niton XRF X-rays can penetrate deeper than an X-ray tube-based source.
•The stairwell and laundry room wall LBP readings could not be reproduced and appeared attributable to the cinderblock substrate. Even though the wall appeared to be uniformly painted and undisturbed, lead readings varied from 0.0 to 0.6 mg/cm2. The readings appeared to support this hypothesis.
•The readings of the stairwell ceilings and ceiling beams identified as LBP yielded a majority of the results as 0.0 mg/cm2. Three detectable concentrations were obtained (0.17-0.4 mg/cm2), all without a “surface” flag. The surface flag is a qualitative measurement that indicates if a majority of lead detected is at the surface or within the upper few coats of paint. It was judged unlikely that stairwell ceilings would be repainted many times to cause the lead to be detected as buried. It would appear most likely that interferences were obtained by the Niton XRF results from lead or other impurities in galvanizing on the rebar or metal lath for the ceiling.
•An LBP reading for a painted concrete floor could not be reproduced. It was thought that the false positive reading could have been a random aggregate/ metal rebar interference or a plumbing or electrical line below the slab. Similarly, a few anomalous concrete ceiling readings could not be reproduced. In one building, the textured ceiling reportedly (according to maintenance personnel) contained fine glass-like beads or crystals. It was unknown if these beads caused some type of interference or a concrete substrate interference had occurred.
•Several LBP readings on interior wood casings and window mullions were not reproduced. It was believed that the Niton XRF’s stronger signal had picked up readings of the paint on the exterior of the building, which was unquestionably LBP.

The Element of Surprise
Reviewing sample spectra need not be limited to assessing false positives for interferences. For curiosity sake, it can be downright interesting and instructive to look at sample spectra for other metals. For example, one time I encountered a bright blue porcelain toilet. Being curious, I tested it. The spectral revealed that the blue was apparently attributable to a zirconium salt pigment.
A certain distributor was testing imported dishware for lead in the glaze. The technician just happened to look at the spectral data for a certain red plate when a detection of lead was shown. The technician was quite surprised to discover from the spectral lines that the ceramic was also contaminated with uranium!

Working Towards Reducing Electron Fraud
In conclusion, XRF is an amazing technology, enabling the user to collect the large amounts of data conveniently and cost effectively in a non-destructive manner. But, it does have its limits. Data should be looked at with a critical eye. It should be understood that some false positives (and less commonly false negatives) will occur, particularly with large data sets. In my opinion, it is unacceptable to avoid addressing apparent false positives on a project based on the concern that eliminating the presence of LBP from a site could eliminate a potential source of future work! We should care enough about our clients to avoid placing unnecessary regulatory burdens on them due to anomalous false positive results. Our industry should take more care in presenting accurate XRF results to our clients.
Users can look to spectral science for answers when questionable results are obtained. However, its often much easier to just collect additional XRF shots or if needed, confirmatory paint chip samples for laboratory analyses.
If you are a landlord, governmental entity or other property owner who has a Lead-Based Paint Inspection report, look it over! Does it make sense? Are there any scattered random components identified as LBP or are there fairly consistent patterns. If you can answer "Yes" to the former condition, Tri-Tech may be able to help you evaluate these possible false positives.
This article has referenced the possible short-comings of three common XRF units used for lead testing (the Innov-X, Niton XLP and RMD-LPA). The reader should understand that no claim is made that any particular XRF is superior or inferior. There are a number of approved XRFs that use different radioactive sources and energies. As such, every units has advantages and disadvantages in accuracy depending on the target metal, the target concentration, the substrate and other factors.
Tri-Tech is an industry leader in providing accurate XRF lead paint testing data. How can we help you?